Preparing to raise the equtiy quota for a year end really. But longer-term risks for equities are high as this bull market is now very old.
Almost all equity markets have sustained big losses in recent weeks. So our defensive positioning, in particular the decision to underweight equities, has paid off. A year-end stock market rally is likely as many equity markets are technically “oversold“. We are preparing to increase our equity weighting on a short term, tactical basis. But medium and long term risks for equities are unfortunately still high. The current equity bull market, which began in Q1. 2009, is on an historical comparison already very old. Moreover, various metrics indicate that equities are expensive, especially US tech stocks.
Underweighting equities has paid off
We have been defensively positioned for some months, in particular through an underweighting of equities and a very cautious approach to emerging markets (in terms of stocks, bonds as well as currencies). This positioning has paid off in the recent period of market declines.
Equities are now technically “oversold”
“Risk assets” have fallen sharply in recent weeks, while government bond yields have generally continued to rise. Various sentiment indicators tell us that some investors are in panic mode, or close to it. Technically, many equity markets are strongly “oversold”.
Preparing for a short-term, tactical increase in the equity quota
Given the strength of recent down moves, a technical reversal is on the cards. Indeed, we believe current trading conditions are sowing the seeds of a year-end rally. Therefore we are preparing for a short-term, tactical increase in the equity quota, a move which we may implement in early November.
But risks are high for the medium and long term
Unfortunately the medium and long term risks for equities are high. Many markets (but by no means all) are “expensive“. And some areas of the US stock market look extremely expensive when measured against historic norms. The US bull market in stocks, which began in the first quarter of 2009 is, historically speaking, very mature and the current US business cycle is also among the longest in history. Although well over 9 years old, this US business uptrend is still very robust with strong economic and corporate profits growth.
However, the robustness owes a lot to the 2017 tax cutting package, something which may be reversed within the next three years if pressures force a future US government to rein in otherwise enormous levels of US Federal borrowing. Moreover, US interest rates, which have for years been kept artificially low to foster economic growth, will soon be hiked again, with further rate rises expected in 2019. Indeed, with the exception of the Bank of Japan, the world’s central banks are unlikely to be “investor friendly“ in 2019.
Such considerations suggest that any year-end technical rally will not be long-lived and that investors will soon thereafter need to prepare themselves for more difficult times.
Looking at events through “rose-tinted spectacles“can lose you money. So can an overly pessimistic analysis. In what follows we try to assess, for the interested reader, the current situation as objectively as we can. This assessment assumes some knowledge of financial concepts and is at times a bit technical.
Appendix
We order our analysis according to the investment perspective, starting with the long term and finishing with an assessment for the very near term.
The long term: US stocks are very dear
Based on its valuation history the US stock market is very expensive. This is especially true of US tech stocks. The present US stock bull market is very old and one of the longest ever recorded. This same is true for the current US business cycle.
Graph 1 shows that an investor in US stocks today has to pay 33 dollars to own one dollar of trend earnings (as measured by Professor Robert J. Shiller). Only in 1929 and in the tech bubble leading up to the crash of 2000 were US stocks more expensive on this measure.
Graph 1: US stocks are dear based on the Shiller PE
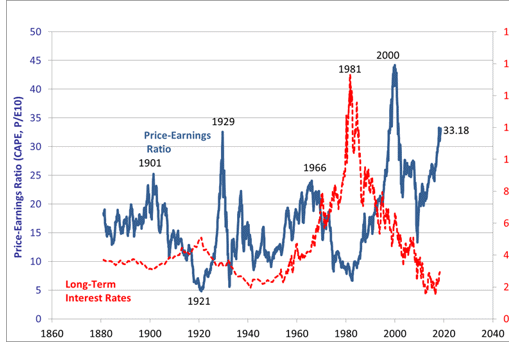
Source: Homepage of Robert J. Shiller
he Shiller model has very good predictive power for future stock market returns over periods of 10 years or more.
Its conclusions as to the present situation are clear: US stocks are likely to deliver very poor returns over the next 10 years.
Long-term conclusion: 90% to 110% of the overall return from the current equity bull market has already been realized. The implication of poor long term future returns applies particularly to US stocks.
The medium term: global equity markets are somewhat dear but not very dear
In the US Professor Shiller’s estimates of trend earnings go back to the 1880s. We do not have such a long term history for other markets. Outside the US, earnings valuation models tend to be less conservative and based on current earnings data.
Graph 2 shows the results of a less conservative model than the Shiller PE. This is a “cointegration valuation model“, with a decent predictive power over the medium term (2 to 5 years out).
Graph 2: Valuation model for the MSCI World equity index
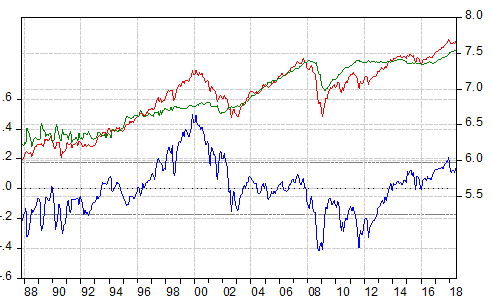
Source: Thomson Reuters & Datastream, eigene Berechnungen
The red and green lines show respectively the development of the MSCI World equity index and the estimated “fair value“ of this index, both in logarithmic terms (RHS). The estimates of fair value are based on profits and interest rates, with fair value varying inversely with interest rates. (Fair value is higher when interest rates are low and visa-versa). The blue line (LHS) shows the implicit over and undervaluation – i.e. the difference between the reported value of the MSCI World index and its estimated fair value – in percentage terms. During the tech bubble of 2000 the blue line reported a value of 0.4, in other words indicating world stocks were some 40% overvalued. During the financial cash of 2008 the blue line – at minus 0.4 – indicated world equities were some 40% undervalued. At present, this medium-term valuation model, suggests world equities are around 14% overvalued.
But there are some equity markets which are already approaching an attractive valuation. Certain emerging markets are in this group, having already experienced a substantial degree of correction.
Medium-term analysis has to consider the outlook for the business cycle, future interest rate developments as well as the outlook for fiscal policy and taxes.
A slight weakening of world economic growth is in prospect
The global economy has lost some momentum of late. US-China trade hostilities seriously complicate the investment outlook for many companies, adversely impacting economic growth rates. We predict global economic growth will continue to weaken.
Central banks will on balance be withdrawing liquidity in 2019. They will no longer be friendly so far as the investment markets are concerned
Up until the end of this year, the central banks are likely to be net injectors of liquidity as the more restrictive policies of the Fed will still be more than offset by the expansionary policy stance of the ECB and Bank of Japan. But we expect the world’s central banks will in aggregate withdraw liquidity from the markets in 2019.
The ECB has said that the first cyclical rise in Eurozone interest rates may happen towards the end of autumn 2019. But we expect the Fed will raise US rates another 3 or 4 times before the end of next year. Clearly the hot US labor market – where the unemployment rate, at 3.7%, is at a near record low – and the evidence of rising wage inflation justify further US interest rate rises. Only in the case of highly dislocated equity and property markets would we expect the Fed not to pursue its plans for further monetary tightening. Our assessment is similar for the ECB. We expect it to pursue its clearly communicated policy path and only extreme events – such as a general financial market collapse or a serious deterioration in Italy – will cause it to change tack. In sum, it will take very bad news for the central banks to abandon their increasing tendency to act as financial market policemen and return to what they were – financial market manipulators. With the exception of the Bank of Japan, central banks will not be “equity investor-friendly” in 2019.
Last year’s US tax cuts are not sustainable
The high rate of profits growth US firms are now experiencing owes a lot to the 2017 Trump Administration promoted tax cuts. Escalating US Budget deficits will need to be financed by larger bond issuance. Meanwhile the Fed is gradually reducing its massive bond holdings. The result is increased US government bond supply – both from the Treasury and the Fed – something that will tend to push yields higher, in turn raising Federal debt servicing costs and borrowing needs. We believe that the resulting pressure will force a future US Administration to undertake a significant Budget cutting package within a 3 to 5 year time frame, with tax increases likely to be a part of it.
Overall, global equity markets are moderately overvalued. This, the fact that certain markets have appreciated quite substantially, as well as other business cycle and political considerations, seem in combination to justify an underweight stance with regard to equities on a medium term view..
The near term
Even though stocks are not undervalued it can make sense to overweight them if other considerations outweigh the assessment on valuation. Over the long term, valuation tends to dominate other considerations in determining the correct stance on equities – especially when equity over or undervaluation is extreme. But in the short term other issues, such as technical factors, can dominate.
The most important factor arguing for an equity overweight now is that, following recent sharp losses, stock markets are technically “oversold“. Just like elastic, when they have been pulled down sharply, they tend to spring back up again. We think markets are now ripe for a reversal in direction. Graph 3 shows, with respect to the S&P 500 index how advanced the recent sell-off has become.
Graph 3: S&P 500 is technically very „oversold“
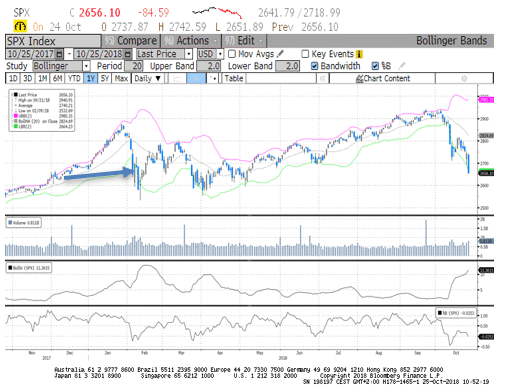
Source: Bloomberg
The Bollinger lines, in red and green, frame the reported performance of the market which shown by the candlestick line.
The Bollinger band is the difference between these two lines and a widening band signals an increase in volatility. The width of this band is shown by the second-from-bottom line in the graph.
In recent trading, the market has breached the lower boundary of the Bollinger band, as happened in the market correction at the start of the year. Should the breach mirror the scale of what happened then (see the blue arrow in Graph 3) we would recommend buying stocks.
There are three other factors which argue for buying equities in the near future:
First: Investor sentiment has turned sharply and pessimism with respect to equities now dominant.
Second: The Trump Administration is weighing further tax cuts. While the long-term impact of such a course would be extremely negative, in the short term it could boost consumer and investor sentiment.
Third: Despite widespread skepticism about seasonal analysis, it is an historic fact that year-end rallies are rather the norm than the exception.
In sum: our analysis suggests that an opportunity to buy stocks on a short-term, tactical basis is close at hand. Should the technical oversold indicator – as shown by the arrow in Graph 3 – become more extended, investors should increase their commitment to equities.
Contact: Thomas Härter, CIO, Investment Office
Telephone: +41 58 680 60 44
Disclaimer: Information and opinions contained in this document are gathered and derived from sources which we believe to be reliable. However, we can offer no undertaking, representation or guarantee, either expressly or implicitly, as to the reliability, completeness or correctness of these sources and the information provided. All information is provided without any guarantees and without any explicit or tacit warranties. Information and opinions contained in this document are for information purposes only and shall not be construed as an offer, recommendation or solicitation to acquire or dispose of any investment instrument or to engage in any other transaction. Interested investors are strongly advised to consult with their Investment Adviser prior to taking any investment decision on the basis of this document in order to discuss and take into account their investment goals, financial situation, individual needs and constraints, risk profile and other information. We accept no liability for the accuracy, correctness and completeness of the information and opinions provided. To the extent permitted by law, we exclude all liability for direct, indirect or consequential damages, including loss of profit, arising from the published information.